
Web · GIS · NOAA Collaboration

GLANSIS
Watershed Lookup

A public-facing web tool built for NOAA GLANSIS that lets anyone look up their HUC8 watershed by address, city, or ZIP — and download a print-ready watershed map. Designed to make environmental data accessible across the Great Lakes Basin, on both sides of the US–Canada border.

Year2026
RoleSoftware Developer
ClientNOAA · Michigan Sea Grant
TeamYelnaz Rysbek, Ji Young Nam, Kyle Stocksdale, Zoe Corser, Jingle Chen
Stack
JavaScript Leaflet.js Turf.js HTML CSS
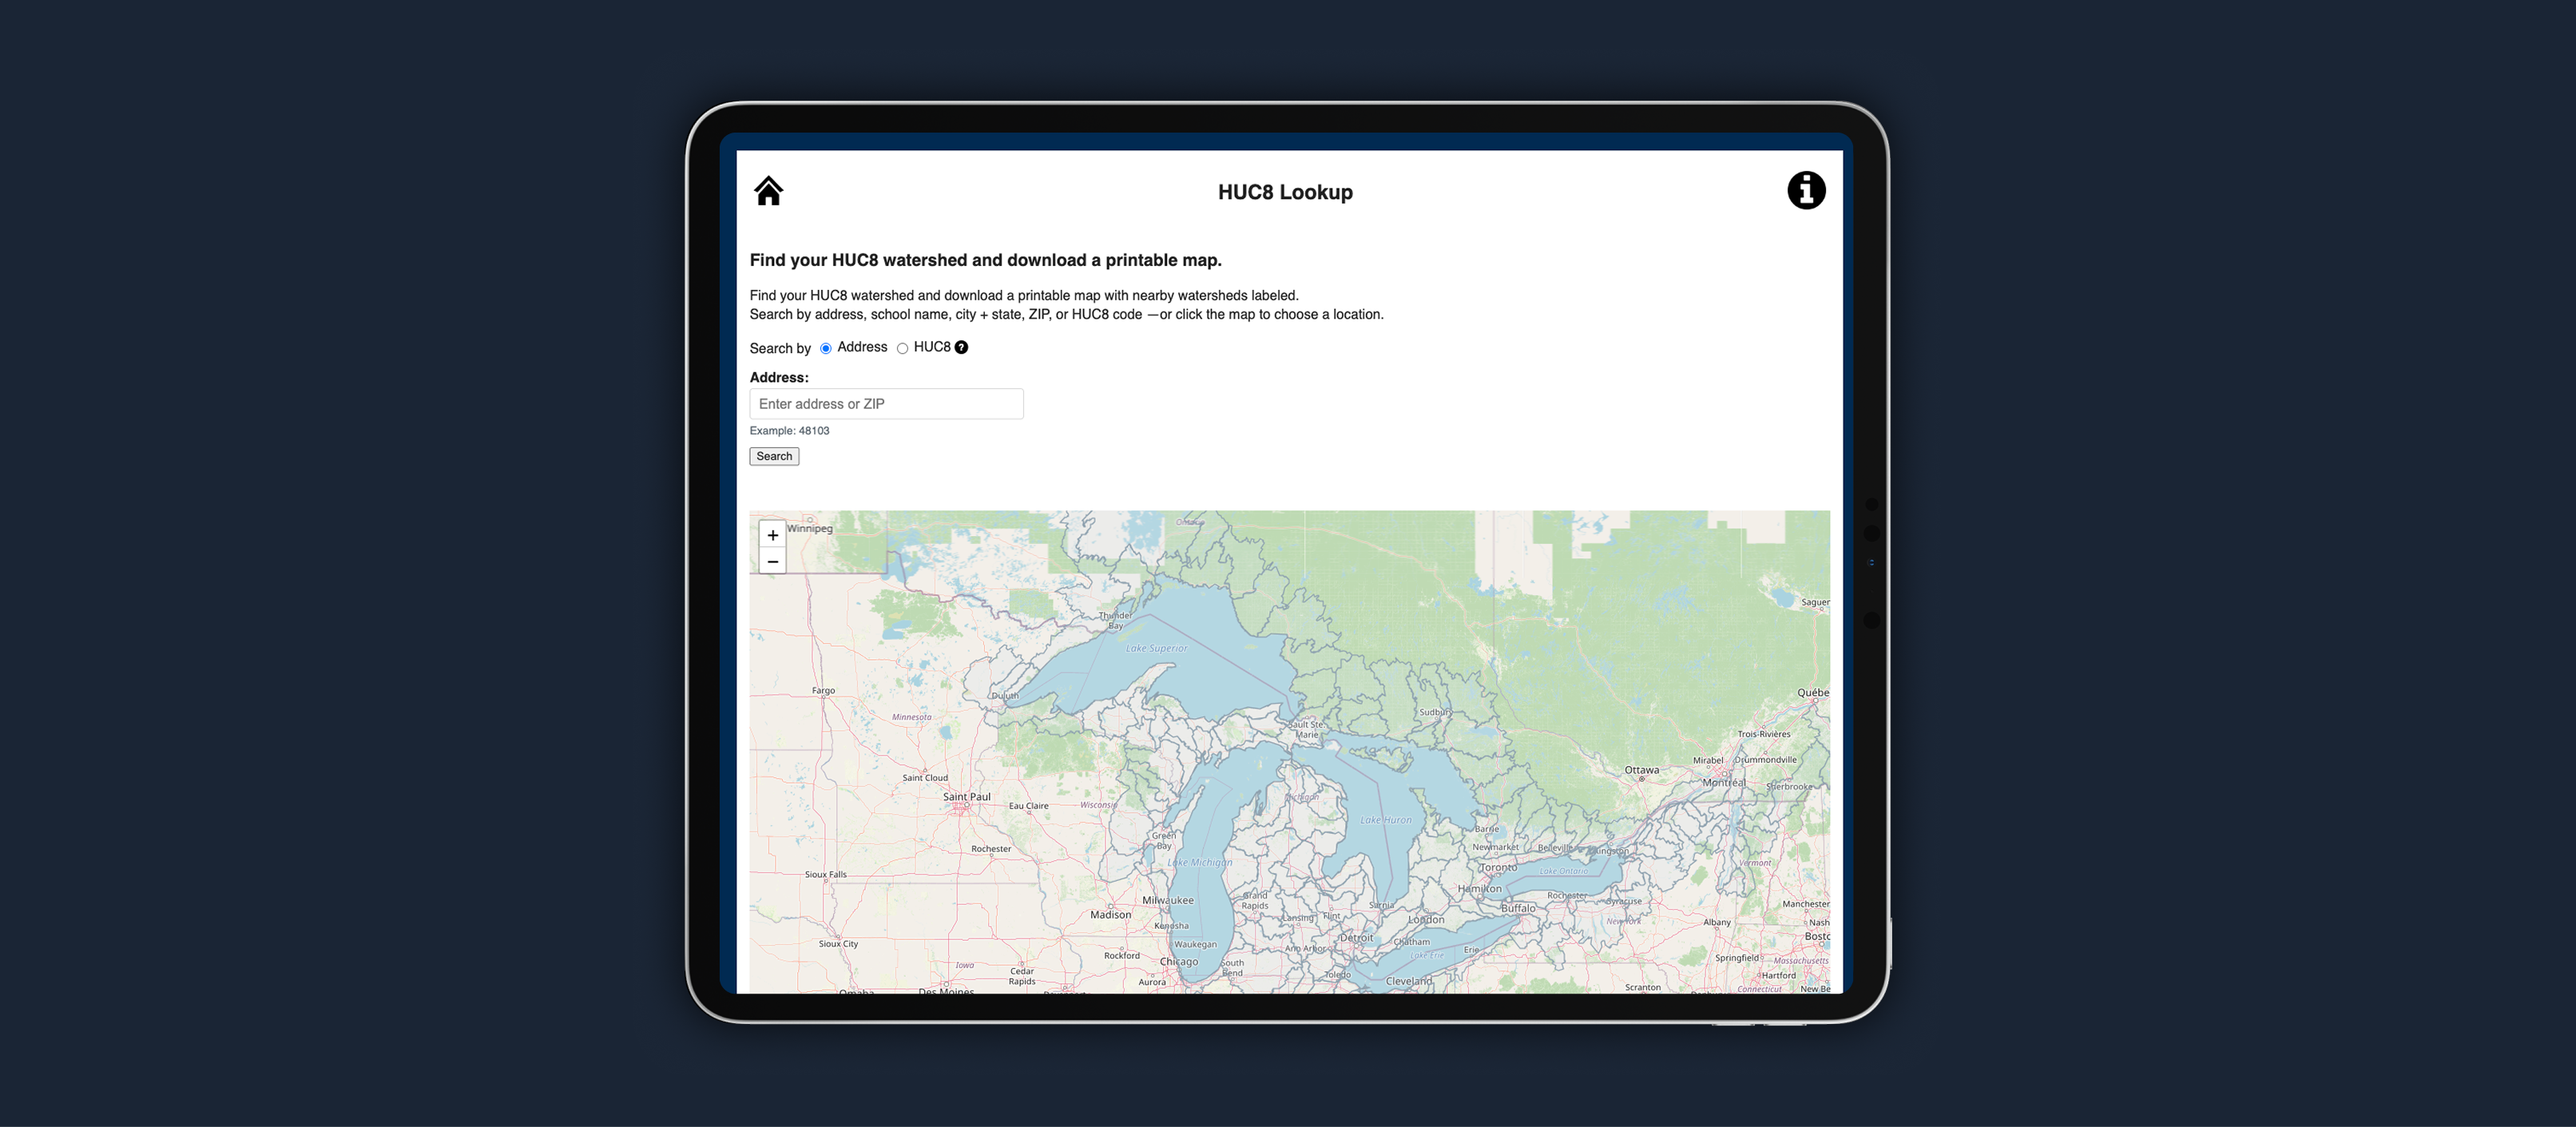
GLANSIS watershed mapper interface

01 — Overview

What is being built

The NOAA GLANSIS HUC8 Lookup tool is a lightweight, public-facing web application that surfaces watershed boundary data for the Great Lakes Basin, covering all 178 watersheds across both the US and Canadian portions of the region. Users enter an address, city, ZIP, or HUC8 code — or simply click the map — to identify which watershed they live in and download a labeled, print-ready PDF map.

Built for NOAA's Great Lakes Environmental Research Laboratory and integrated into the GLANSIS ecosystem, the tool bridges scientific datasets and the general public through a clear, accessible interface. Crucially, coverage extends across the US–Canada border, reflecting the basin's geography rather than stopping at a political boundary.

Demo Try the tool in action

02 — Problem

The challenge

Accessing local watershed data through GLANSIS requires a HUC8 code — an eight-digit hierarchical identifier assigned to each watershed unit. While working alongside educators on a pilot project, the team discovered that both teachers and students struggled to find their code: the USGS and EPA tools that used to provide this have either disappeared or reference older versions of the data layer.

An initial attempt — a layer toggle on the existing zoomable map explorer — proved insufficient. The map was difficult to navigate to the right extent, codes were hard to read at any zoom level, and printing a usable reference map was effectively impossible. The pilot classroom was served by hand-delivering custom maps, but that wasn't a solution — it was a workaround.

Recognizing that the same friction was likely limiting the database for a much broader set of users, they approached us to build it: a simple, public-facing lookup tool that could translate an address into a watershed — and put a print-ready map in anyone's hands in seconds.

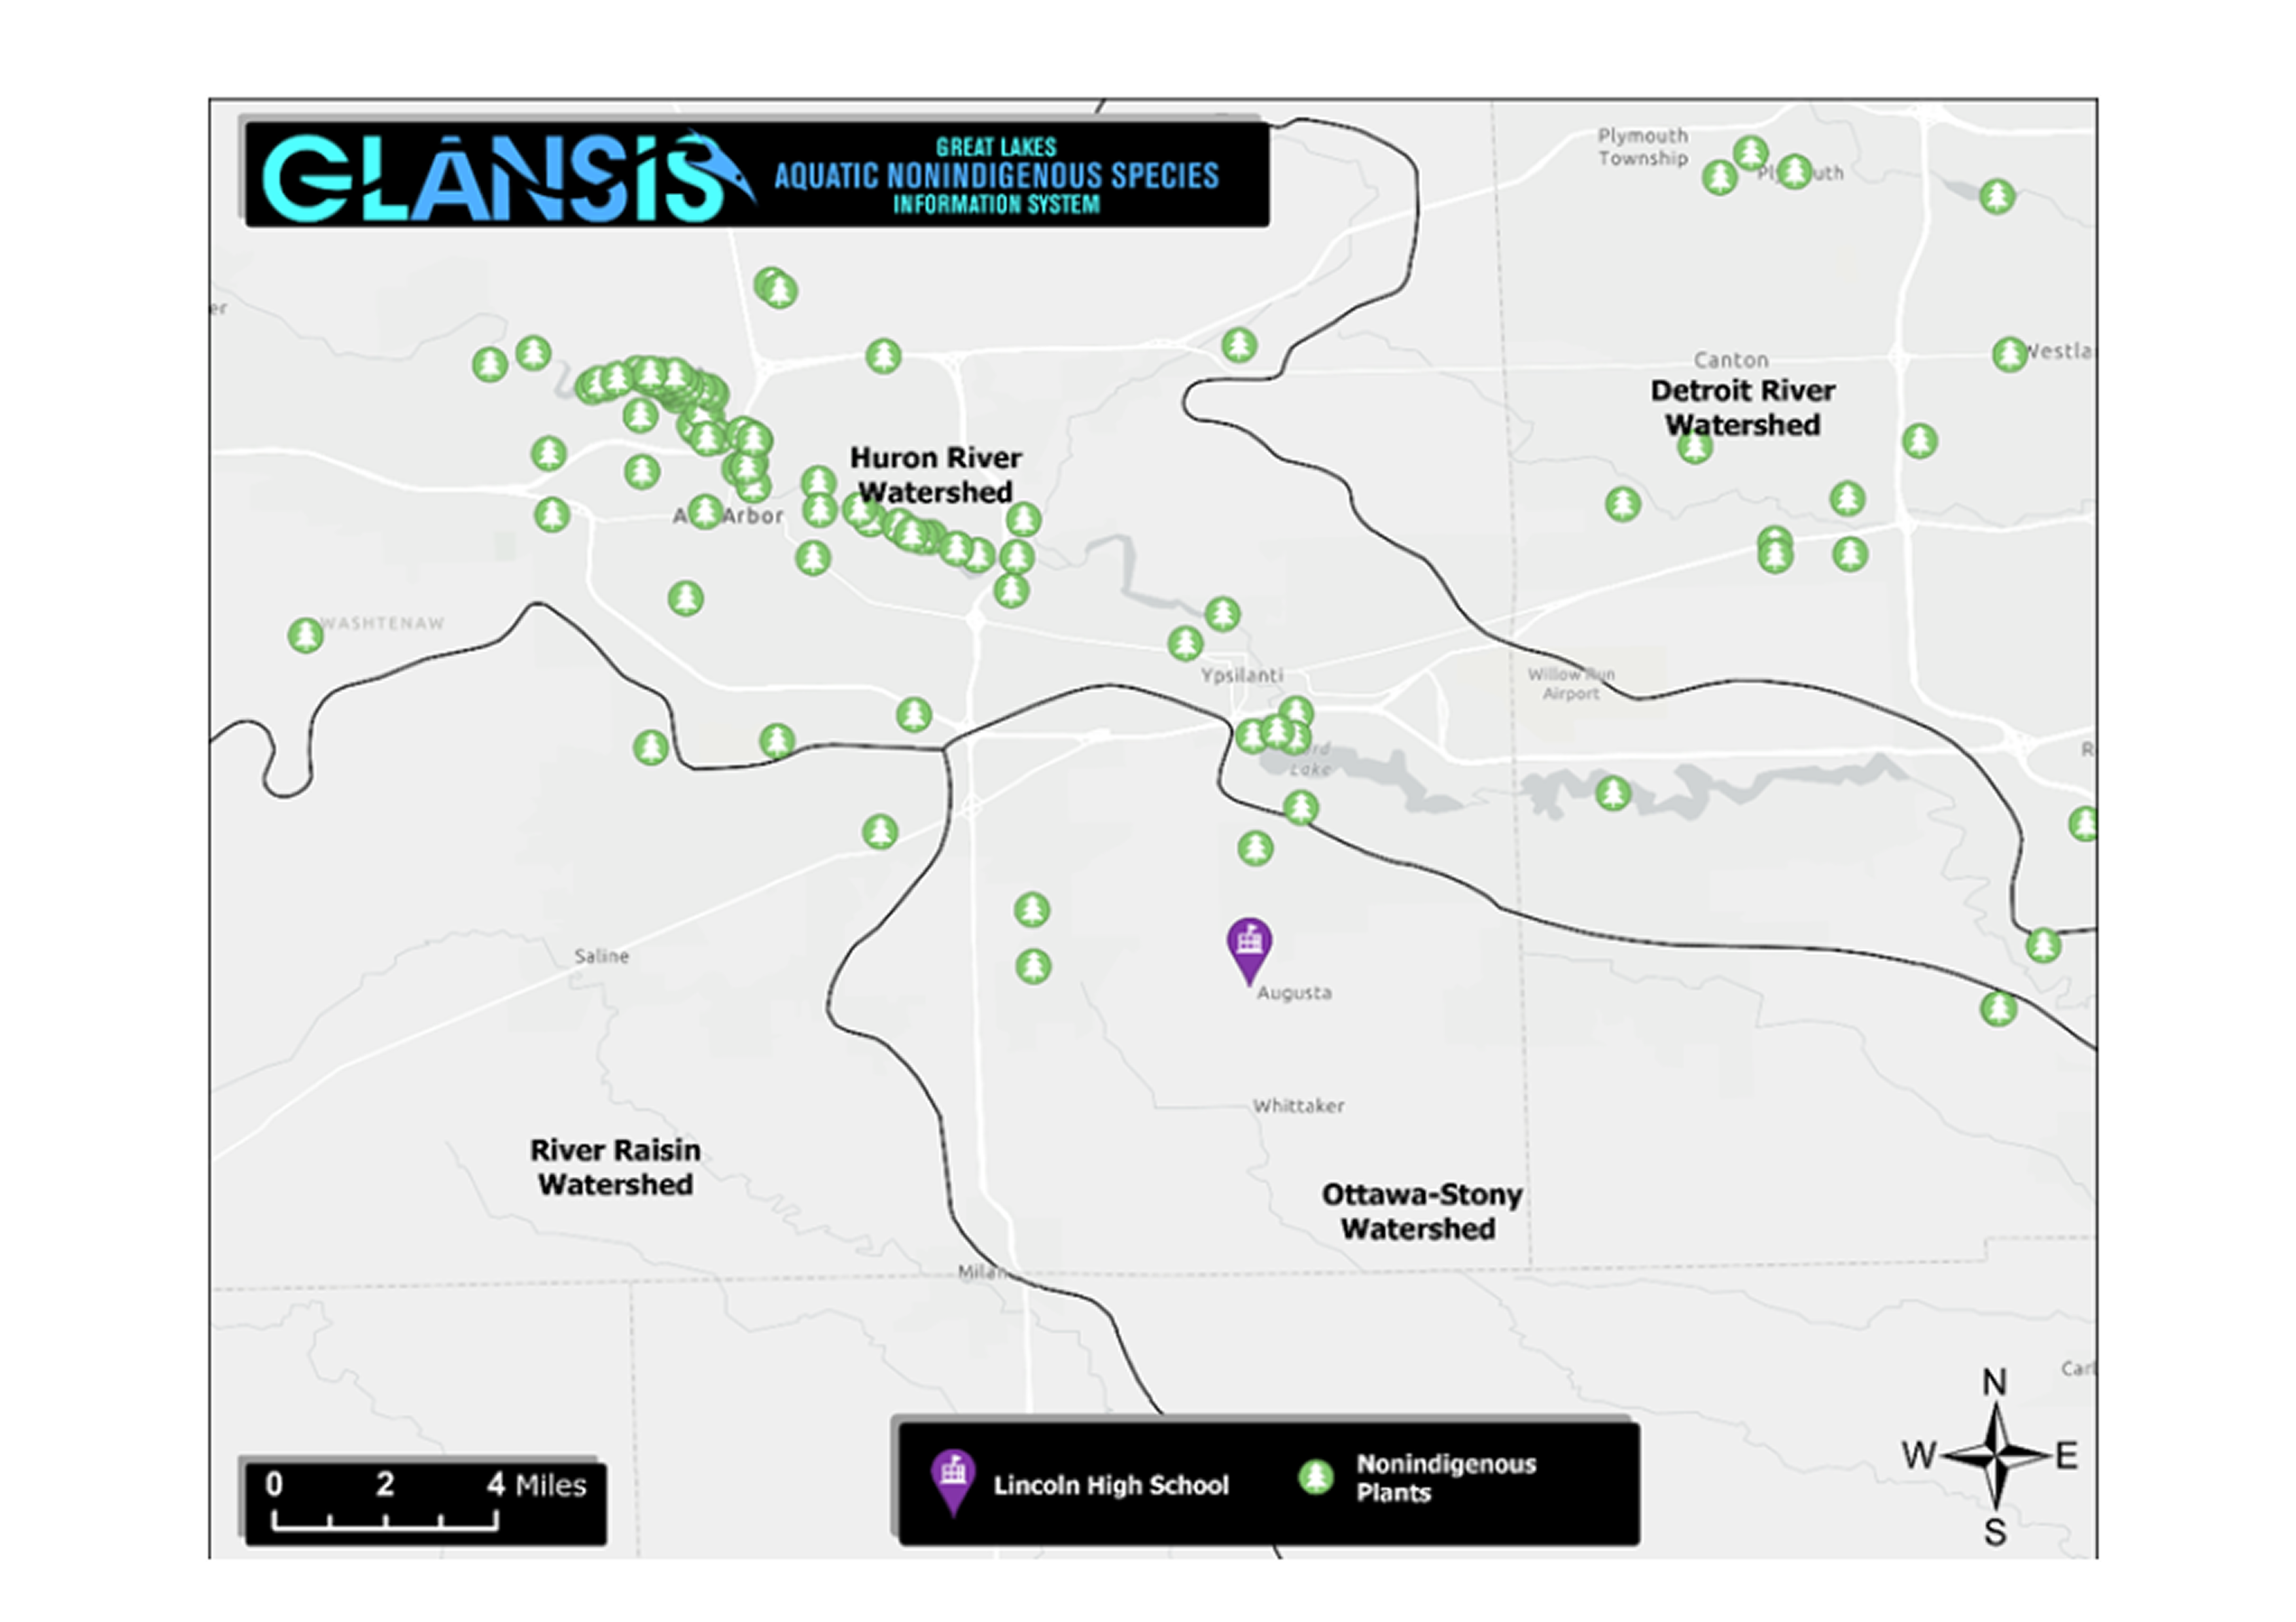
Before: manually created custom watershed maps
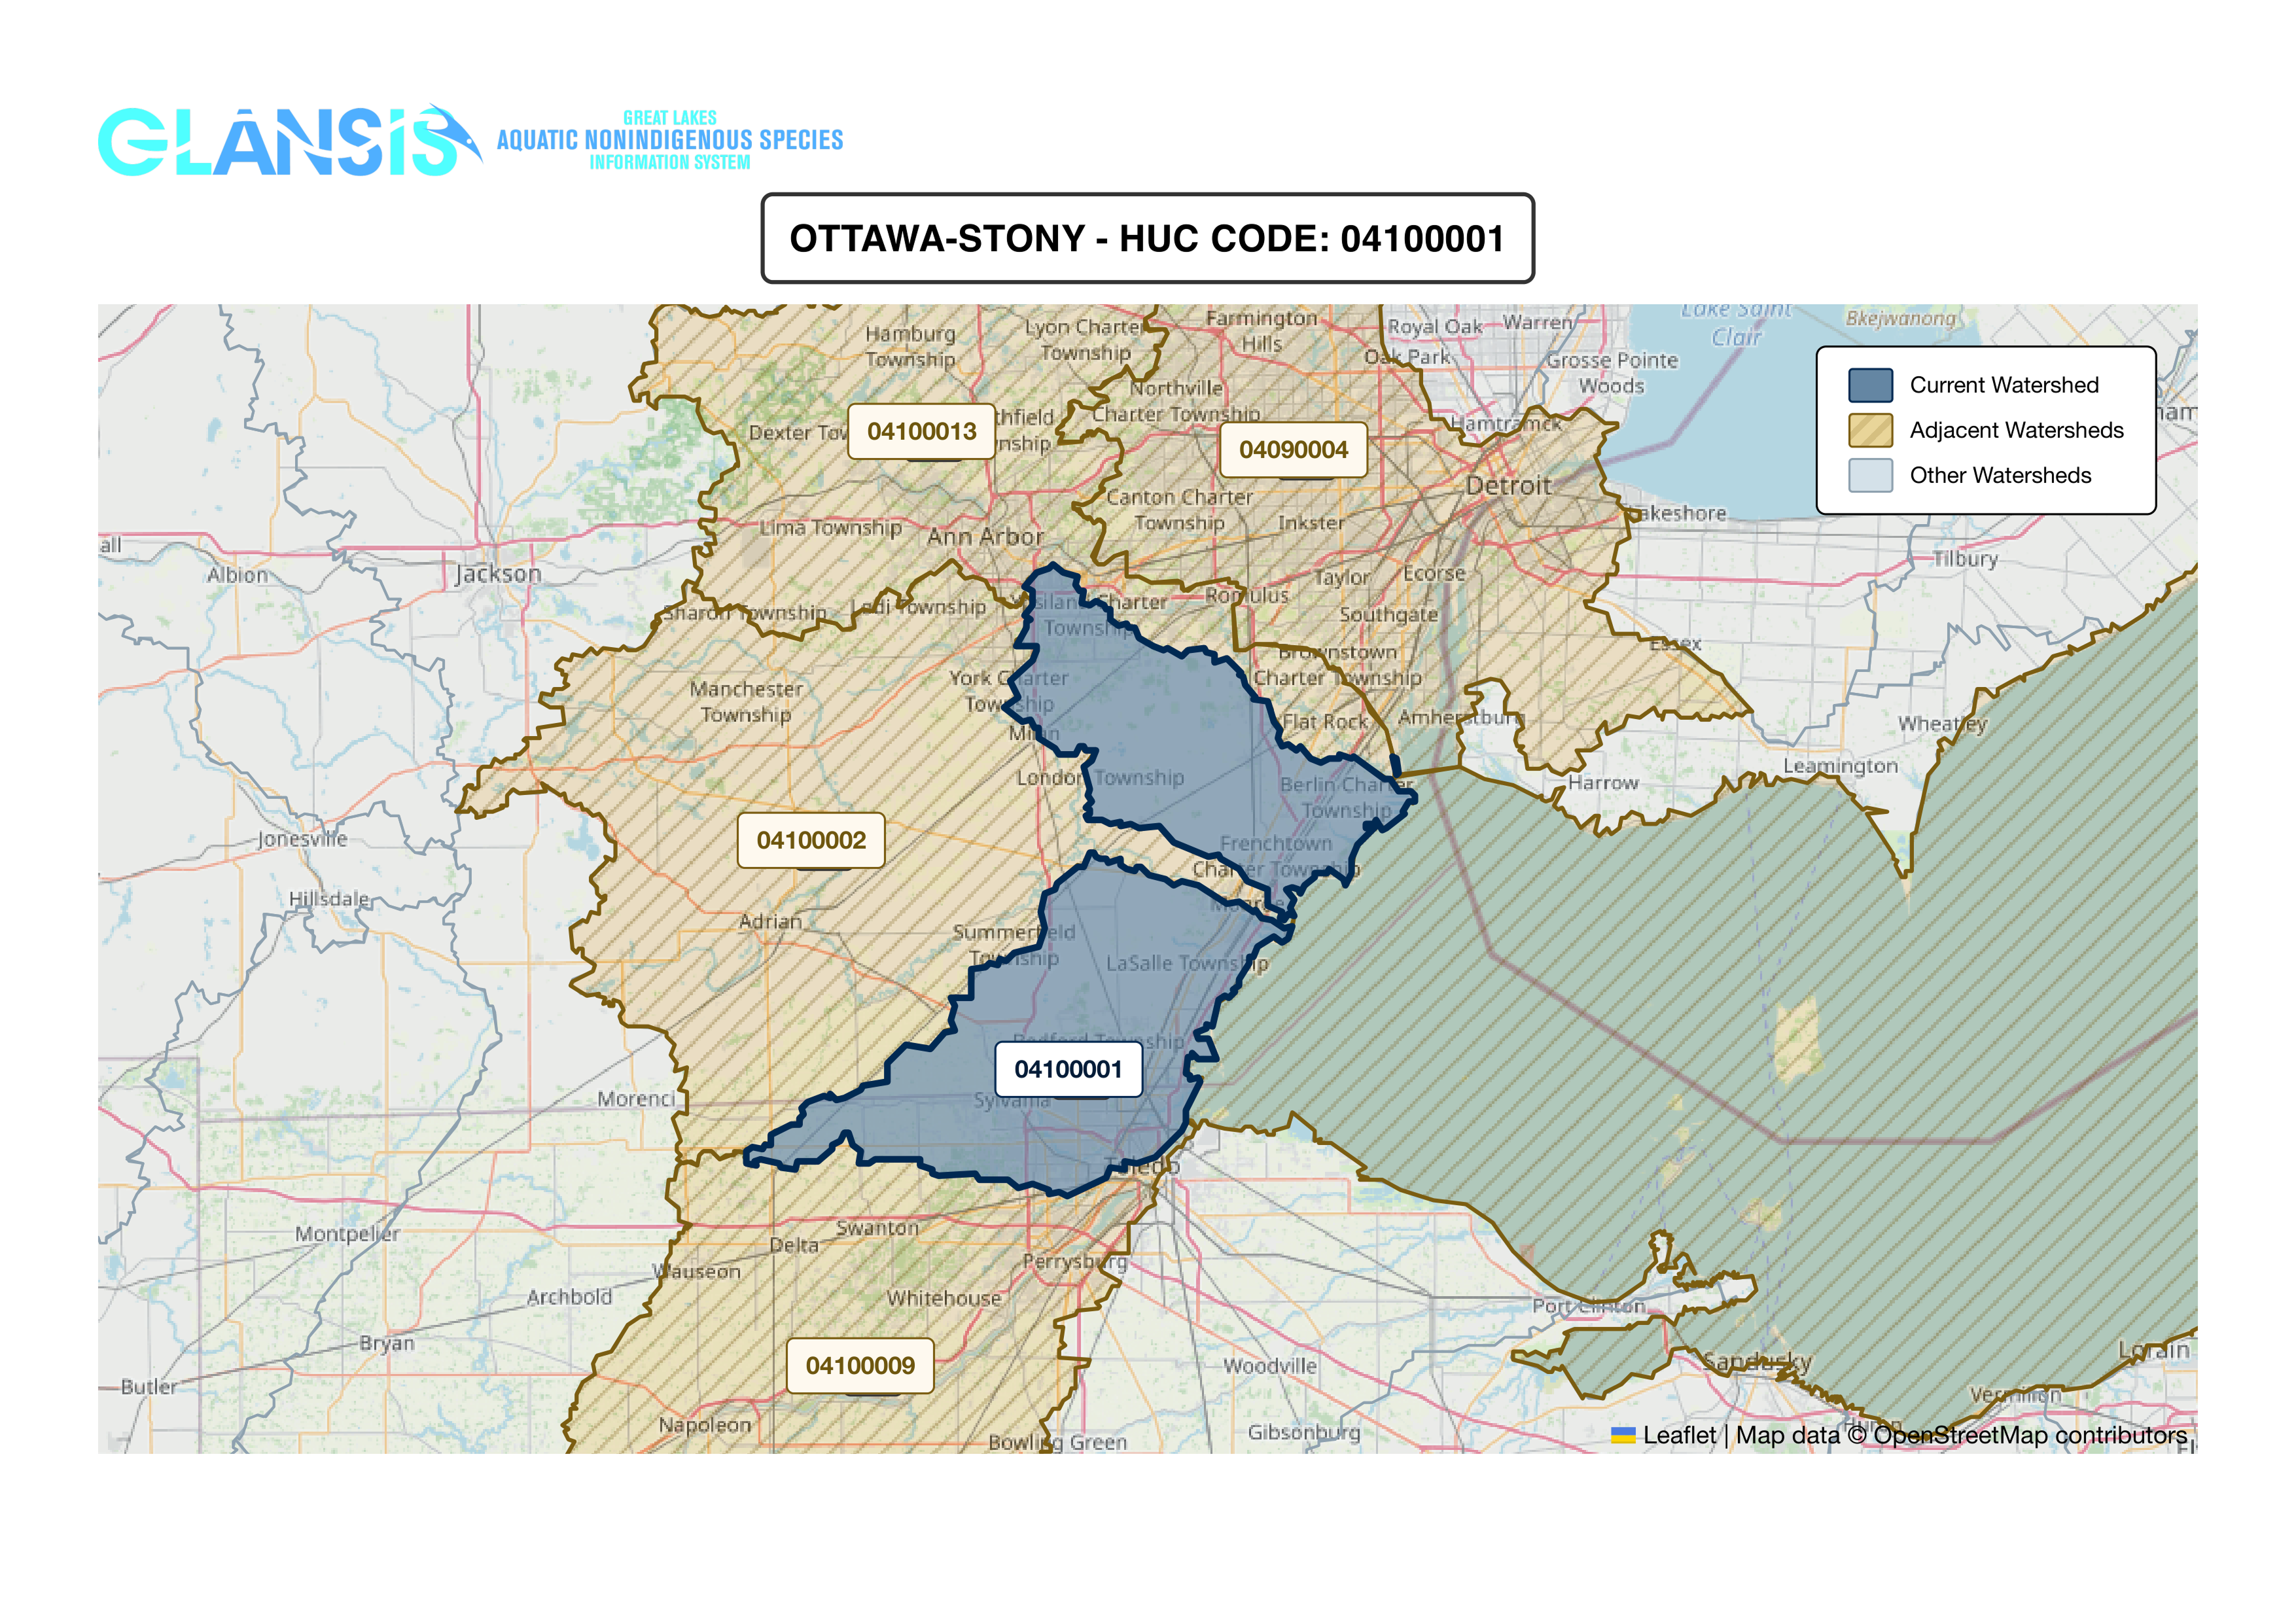
Target: system generates the map from an address

03 — Process

How it is being built

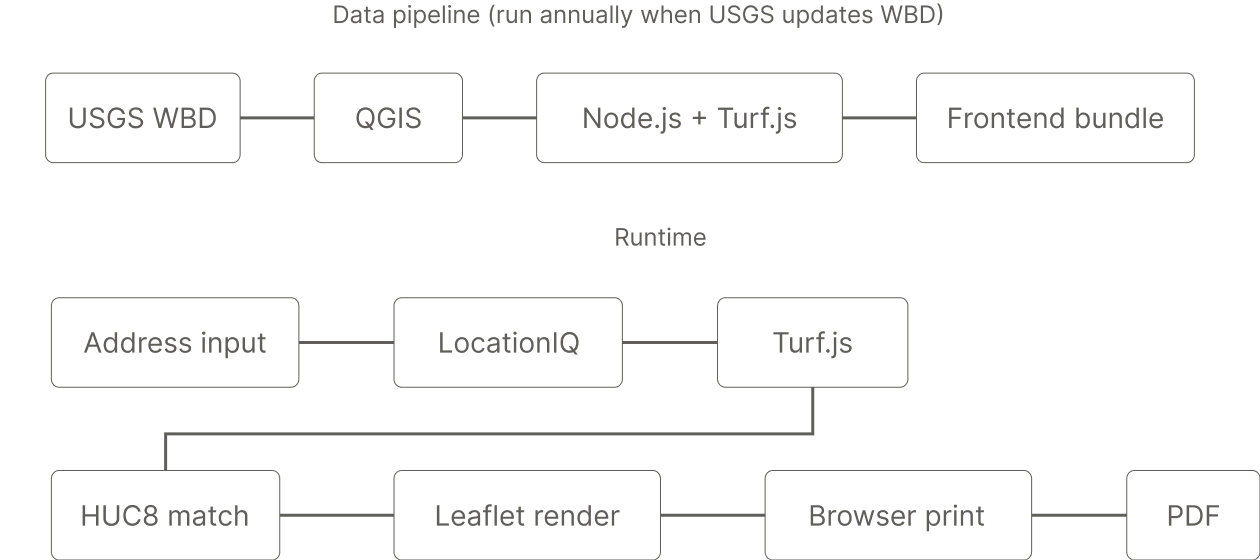
A key constraint shaped every technical decision: NOAA has limited access to commercial software licenses and limited capacity to manage infrastructure once a tool is published. The system needed to be free to run, easy to hand off, and nearly maintenance-free.

The watershed boundary data was downloaded from the USGS National Hydrography Products repository and cleaned in QGIS — stripping the dataset down to just the Great Lakes Basin polygons and the properties needed at runtime. The result is a single lightweight GeoJSON that loads entirely in the browser, keeping the system simple and server-free.

System architecture

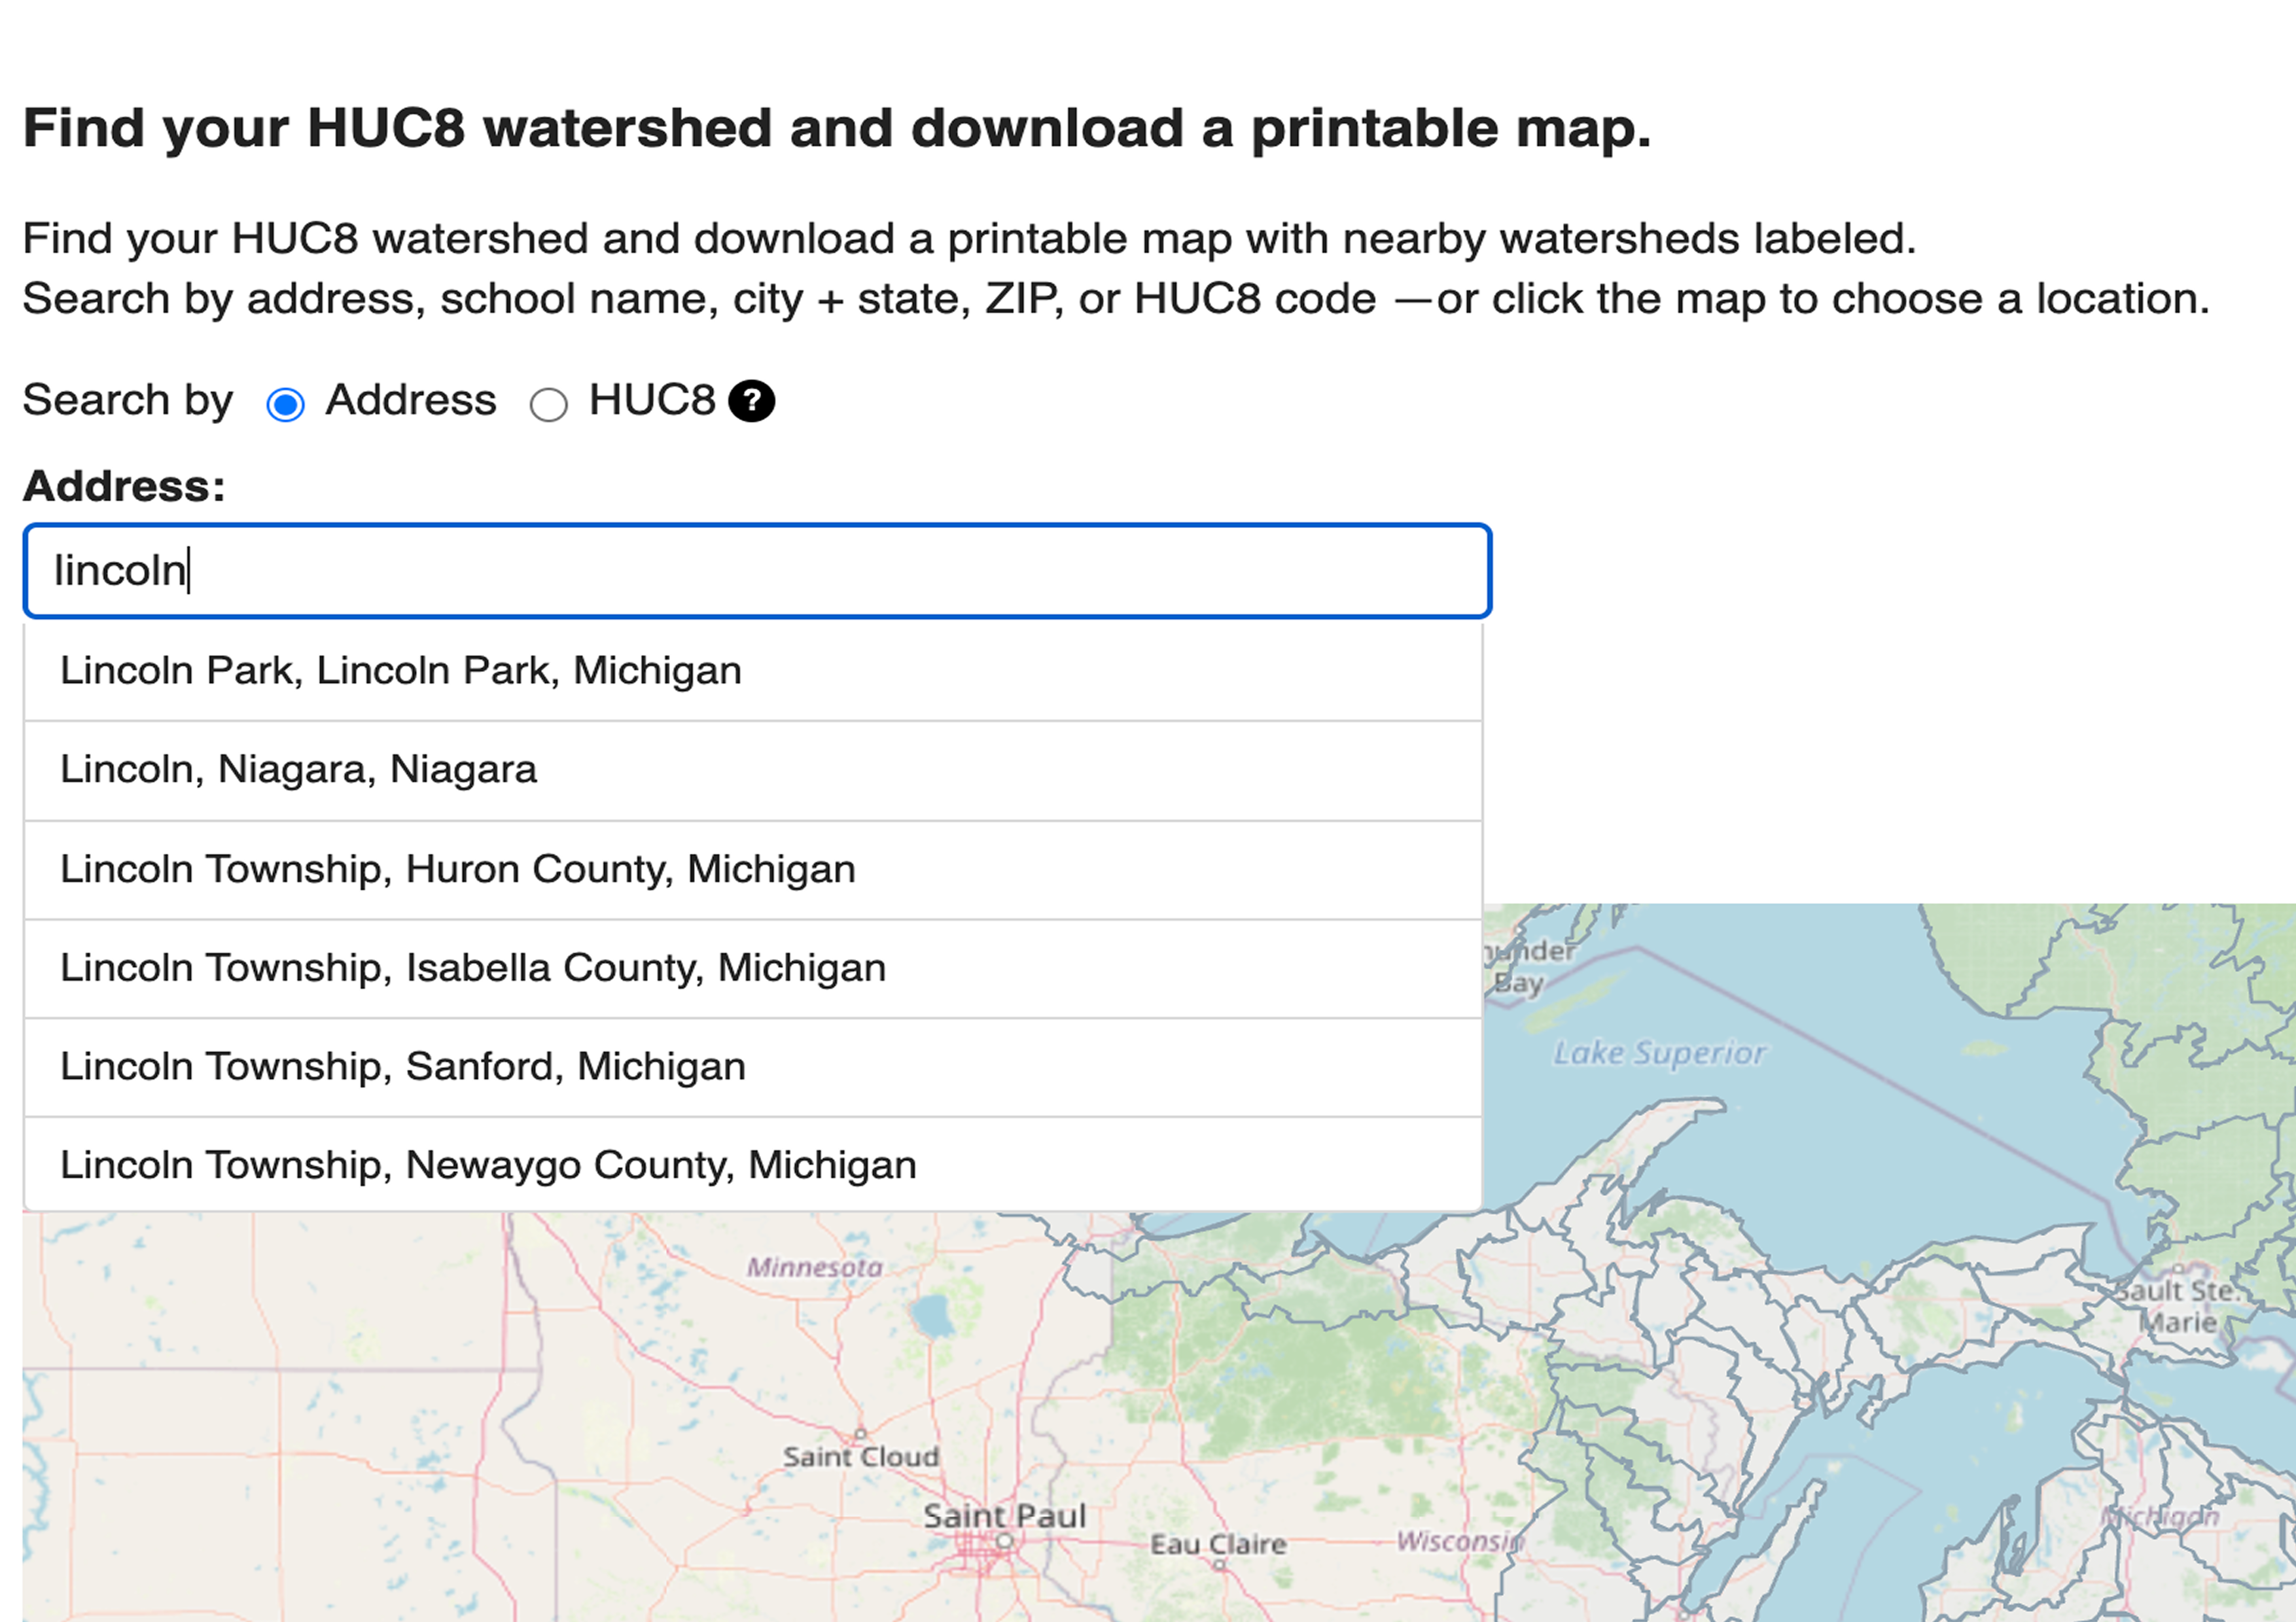
Adjacent watershed relationships are pre-computed by a custom Node.js script that uses Turf.js to detect which polygons share a boundary. Address lookup and autocomplete are handled by the LocationIQ API, resolving typed input to coordinates in real time, then passed to a point-in-polygon query to identify the matching HUC8 unit.

The print flow uses the browser's native print capabilities rather than a server-side renderer — the page layout is print-styled so the output is a clean, labeled watershed map the user can save as a PDF or send directly to a printer.

Real-time address suggestions via LocationIQ
Browser-native print flow outputs a labeled watershed PDF

04 — Outcome

What is achieved

The tool launched as a publicly accessible utility within the GLANSIS ecosystem, used by educators, conservation organizations, and watershed councils to produce reference maps without needing GIS expertise. The address-to-map flow takes under ten seconds on a standard connection.

What used to take teachers two weeks — waiting on a NOAA employee to generate and send a map — now takes under two minutes to print directly. During our final presentation, a county clerk noted it would also simplify her grant writing process, where navigating NOAA's internal resources had previously cost her significant time.

The project is a practical demonstration of how federal environmental datasets can be made accessible through thoughtful interface design — a throughline I find compelling across public-interest technology work.
05 — Reflection

What I learned

This project taught me a lot about the friction between scientific data infrastructure and general public usability. Geospatial data in particular carries a steep conceptual overhead: coordinate systems, projections, polygon complexity, that designers have to quietly absorb and resolve before a user ever opens the page.

Working within a federal partner context also sharpened my understanding of institutional constraints on design: accessibility compliance, attribution requirements, and data citation standards are not optional, and building for them from the start is far less painful than retrofitting.

If revisiting, I would work on automating the data pipeline. Currently, when USGS updates the Watershed Boundary Dataset, a NOAA employee has to manually extract and reprocess the watershed polygons, a bottleneck that ties ongoing accuracy to institutional bandwidth. Automating that sync would make the tool more resilient and reduce the maintenance burden on the team.